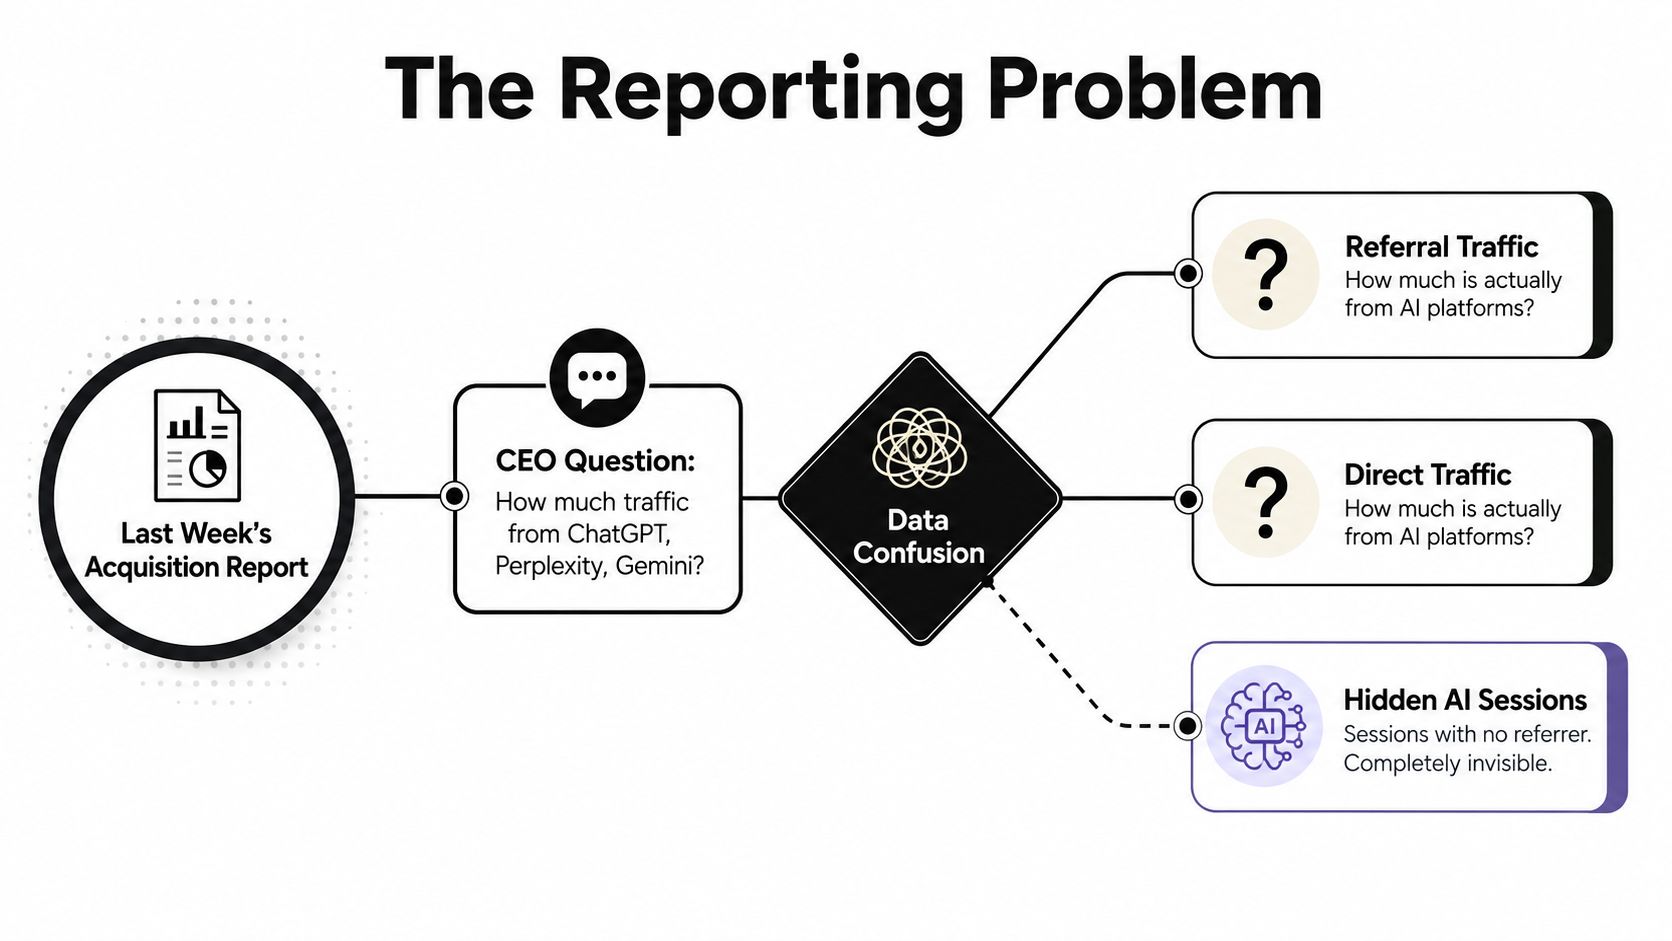
A senior analyst opens last week's acquisition report. The CEO asks how much traffic ChatGPT, Perplexity, and Gemini generated. Recognizable referral domains appear, followed by a large Direct row. The visible referrals may show only the measurable edge of the effect.
The problem is becoming harder to dismiss. Adobe reported that AI-driven retail traffic grew 62% year over year in July 2026, while AI-driven visits to travel sites grew 119% year over year in the same month. Its Q3 2026 AI Traffic report also recorded double- to triple-digit travel AI traffic growth in every measured month since October 2024.
A useful report therefore separates confirmed AI referrals, automated AI activity, and AI-influenced visits arriving through Direct or branded search. These categories describe different events, so one acquisition count cannot represent them all.
The Reporting Problem Most Teams Are Already Living
A B2B analytics team reviews Session source and medium after an AI visibility push. A recognizable assistant referrer appears, yet it represents only part of the traffic the team associates with AI discovery. Some visitors clicked a cited page. Others remembered the brand, searched for it later, or entered the URL directly. GA4 can classify those sessions as Referral, Organic Search, Direct, or, in some setups, Paid.
That makes the executive question deceptively difficult. “How much traffic came from ChatGPT?” could mean confirmed clicks from a ChatGPT page, visits influenced by a ChatGPT answer, automated requests from an AI crawler, or all three. Each category records a different event, so each needs its own measurement method.
The distinction matters because machine activity has become a meaningful measurement category on the open web. Human Security's 2026 State of AI Traffic and Cyberthreat Benchmark Report found that monthly AI-driven traffic grew 187% from January to December 2025. The report also recorded 7,851% year-over-year growth in AI agents and agentic browsers, alongside 23.51% year-over-year growth in automated traffic and 3.10% growth in human traffic over the same period.
Why a single channel misses the story
A standard channel report answers where GA4 classified a session. It does not identify every factor that prompted the visit. Someone who saw a product mentioned in an assistant response might later search the brand, click a branded result, and appear identical to any other organic visitor.
The opposite problem exists too. An AI crawler can request a page without creating a human session. Counting that request alongside a customer visit would inflate performance and confuse content discovery with audience acquisition.
Practical rule: Treat referral classification as observed evidence that complements, rather than replaces, a fuller view of AI exposure.
Adobe's cross-category analysis, cited earlier, makes retail and travel useful reference sectors because AI referral acceleration is visible in their traffic data. Other industries may show a smaller or less visible baseline, but the reporting logic remains the same.
AI traffic analytics separates these layers instead of forcing them into one disputed count. A layered report can show confirmed referrals, automated activity, and possible influence, while clearly identifying what was measured and what remains unknown.
What AI Traffic Analytics Actually Means
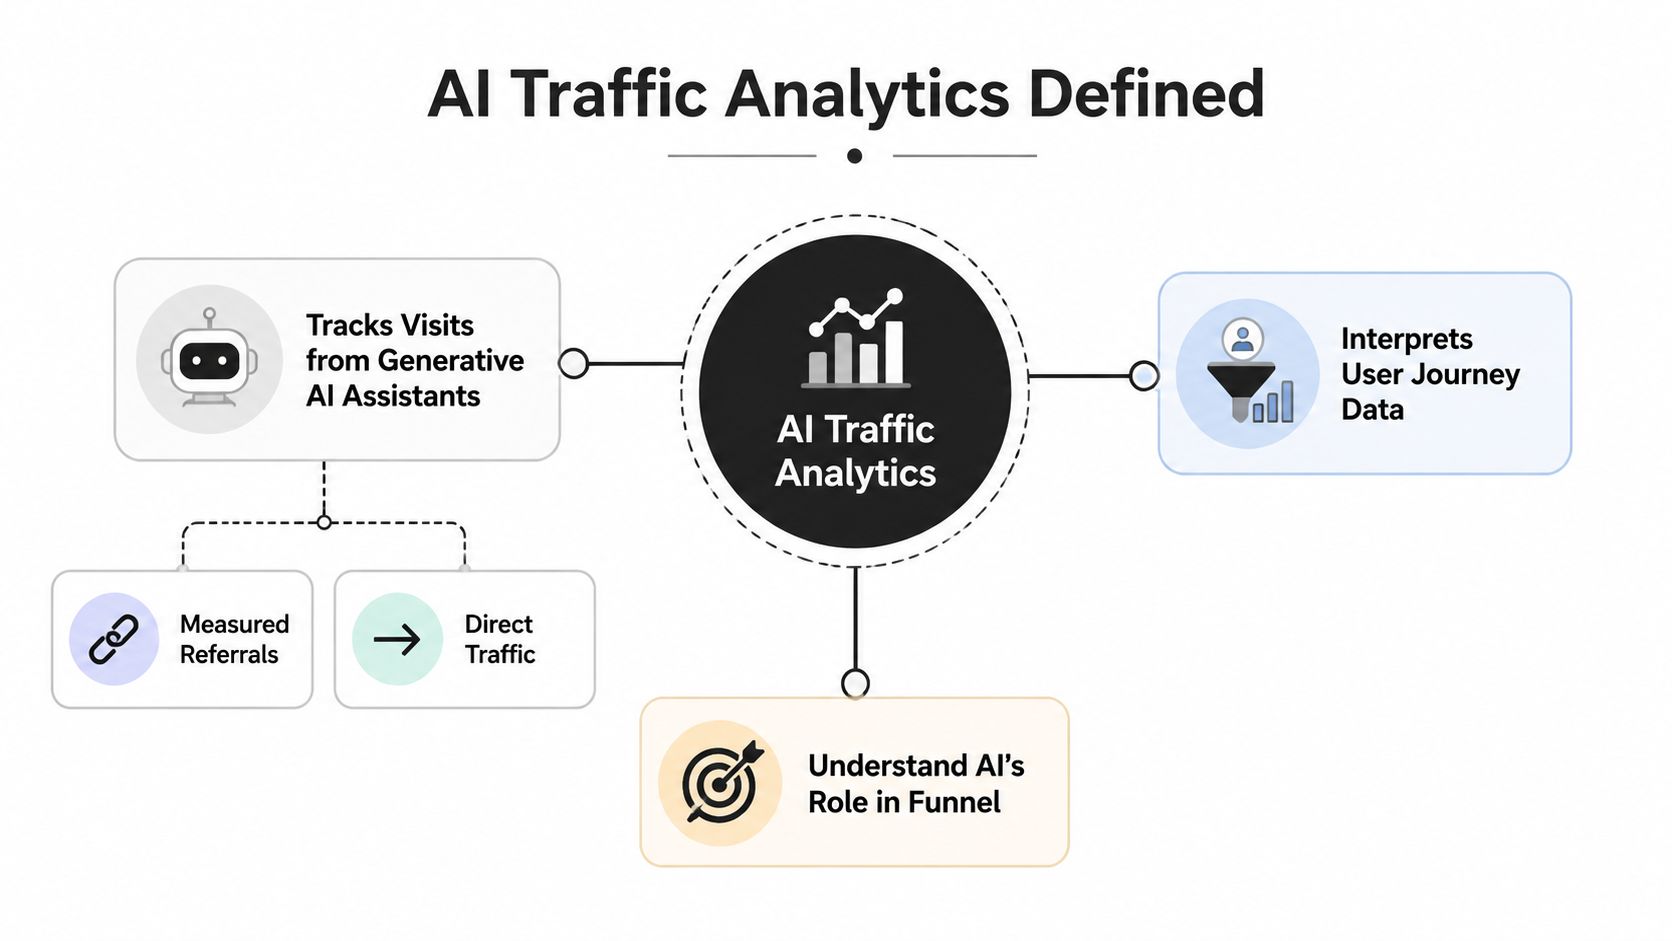
AI traffic analytics is the practice of tracking visits that originate from generative AI assistants and interpreting the wider user journeys associated with AI exposure. The first part is observable when an assistant sends a referrer. The second part is directional when a user encounters a brand in an answer, then arrives through another channel.
A useful analogy is radio. An assistant is the broadcaster. A brand mention or cited page is airplay. A click is a listener who tunes in after hearing the broadcast. Analytics can count the listener who arrives through a tagged path. It can't automatically identify every person who heard the broadcast and visited later through another route.
Three reporting layers
The discipline becomes clearer when the team separates three related but different records:
- Confirmed referral traffic: A human session includes a recognizable assistant source, such as
chatgpt.com / referralorclaude.ai / referral. - AI-influenced traffic: A user may have encountered an assistant response, then arrived later through Direct, branded Organic Search, or another channel. This is not directly observed in standard session data.
- Automated AI activity: Crawlers, scrapers, and agents request pages or perform actions without representing an ordinary human visit. Server logs and bot analysis belong here.
The first layer belongs in acquisition reporting. The second belongs in an influence model with clear caveats. The third belongs in traffic-quality and technical monitoring, not in a human conversion total.
Broader AI search measurement includes more than traffic. It can cover whether a brand appeared in an answer, which pages were cited, how often prompts produced a mention, and how visible the brand was across tested engines. Traffic analytics narrows the question to visits and downstream behavior, while still using visibility data to interpret what the visits may represent.
A concise measurement memo could define the discipline this way:
Working definition: AI traffic analytics measures confirmed human sessions from generative AI assistants, separates them from automated AI requests, and estimates AI influence on other acquisition paths without blending observed and modeled figures.
That wording prevents a common reporting error. A citation isn't a visit, a crawler request isn't a customer, and a Direct session isn't proof of an AI interaction.
The Metrics That Make Up an AI Traffic Report
A useful report is a layered stack, not a flat list of AI-related numbers. The lower layers describe observed traffic. The upper layers describe visibility and influence, where the evidence becomes less direct.
| Metric | Definition | Typical Data Source |
|---|---|---|
| Confirmed AI referral sessions | Human sessions with a recognized AI assistant source or referrer | GA4, server logs |
| Share of voice in AI answers | The proportion of tested answers in which a brand or domain appeared relative to the defined comparison set | Prompt monitoring and answer capture |
| Citation rate | The frequency with which a tested page or domain was cited in captured answers | Answer capture and citation records |
| Prompt coverage | The set of tracked prompts that produced a brand mention, citation, or relevant appearance | Prompt repository and monitoring data |
| Assisted conversions | Conversions for which an AI referral appeared in the recorded conversion path without necessarily being the final touch | GA4 attribution paths |
| Influenced conversions | Conversions associated with an AI exposure signal through a declared model, survey, or experiment | Attribution model, survey, or holdout design |
| Click-through rate from cited sources | Clicks from an answer or cited source divided by the defined exposure base | Assistant referral data and visibility records |
| Branded search lift after AI exposure | A directional change in branded search activity following a defined AI exposure period | Search Console, keyword data, exposure timeline |
Start with observed sessions
Confirmed AI referral sessions are the cleanest starting point. In a GA4-oriented workflow, teams can classify assistant visits into an AI Assistant channel and inspect source and medium entries such as chatgpt.com / referral or claude.ai / referral. WebFX's GA4 workflow recommends segmenting those sessions by landing page, engagement, and conversions.
Analysts should examine the landing pages, session quality, and conversion paths rather than treating volume as the final answer. A small channel can still matter if its visits concentrate on high-intent pages.
Add visibility without confusing it with traffic
Share of voice, citation rate, and prompt coverage describe what appeared in tested answers. They don't prove that a person clicked. UseCite's research collection reports that one 2026 panel found 11,131 citations across 1,872 domains from six answer engines over 29 snapshots. That finding illustrates why citation reporting needs an engine, prompt set, snapshot date, and page-level record.
The same source describes large differences across engines and associates citation behavior with factors including metadata and freshness, semantic HTML, and structured data. Those observations support a volatility warning. A single share-of-voice figure without the tested prompts and engine context is difficult to interpret.
Treat influence as a separate layer
Assisted conversions and branded search lift can support an influence hypothesis. They can't establish that an assistant exposure caused a conversion unless the measurement design tests that relationship. A post-exposure survey can add useful evidence, but survey recall remains different from a tracked referral.
Google AI Overview citation patterns also argue against using only traditional rankings as a visibility proxy. Digital Applied's analysis reported that 38% of AI Overview citations came from the traditional top 10 organic results, 44% came from pages ranking 11th through 100th, and 18% came from sources not in the top 100 for the same query. The source concerns Google AI Overview citations, not human traffic, so the metric belongs in the visibility layer.
How to Set Up AI Traffic Analytics in GA4
A GA4 report can identify assistant referrals when the referrer survives. It cannot reconstruct every session influenced by an earlier assistant exposure. Set up the reporting layer to classify confirmed visits accurately, while keeping influence signals separate.
Build the channel rule
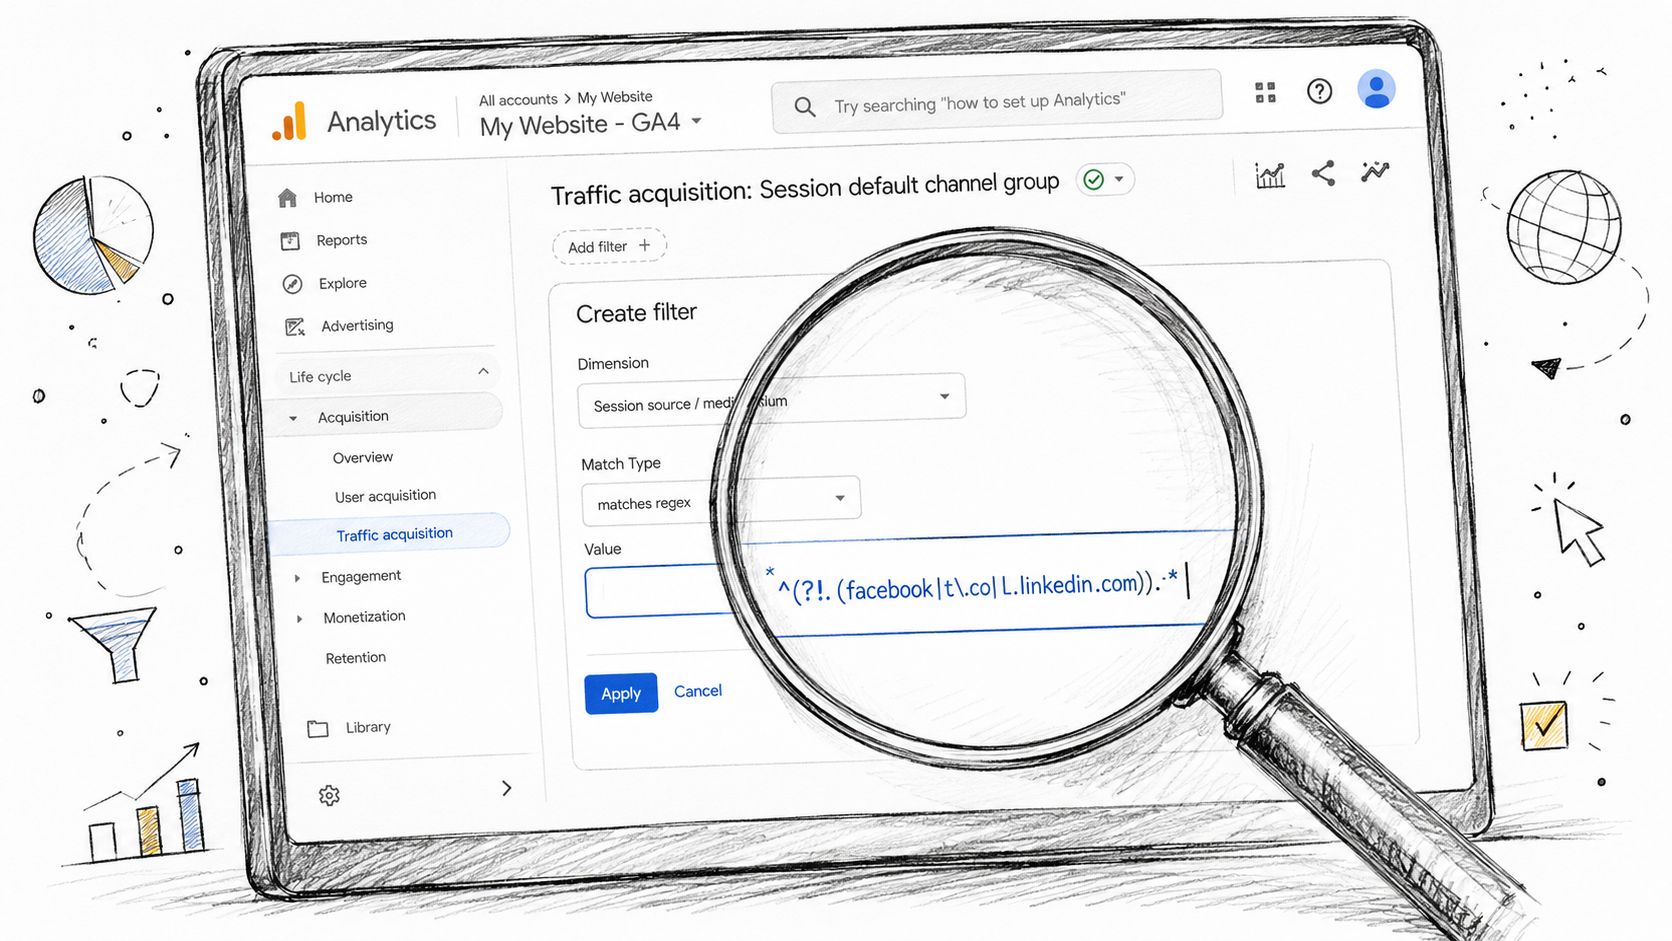
Create a custom channel group or channel for assistant referrals. Match the source field against domains such as chatgpt.com, chat.openai.com, perplexity.ai, you.com, claude.ai, gemini.google.com, and copilot.microsoft.com.
A practical regular expression is:
chatgpt\.com|chat\.openai\.com|perplexity\.ai|you\.com|claude\.ai|gemini\.google\.com|copilot\.microsoft\.com
Adapt the pattern to the sources in your own data. User-agent signatures can identify automated requests when available, but keep those requests outside the human referral channel.
Place the AI channel above the broad Referral rule. GA4 evaluates channel conditions in order, so a catch-all rule placed first can absorb the session before the specific assistant condition runs.
Configure the Explore report
Use Traffic Acquisition for the standard view, then create an Explore report for diagnosis. Add Session source, Session medium, landing page, page template, engagement, and conversion event as dimensions or breakdowns. Filter the report to the AI channel, then add assistant domain as a secondary breakdown.
A useful configuration is a free-form exploration with assistant domain in rows, landing page in columns, and sessions, engaged sessions, and conversions as values. This layout shows whether one assistant sends traffic to a narrow set of templates or distributes visits across the site. Keep the date range and conversion definitions consistent with Organic Search and Direct comparisons, as noted in the WebFX's GA4 guidance.
Validate before publishing
Compare GA4 totals with raw server logs for the same period. Differences are normal: tags may be blocked, referrers may disappear, and an assistant may fetch a page server-side without creating a browser session.
Use a weekly checklist:
- Review source strings: Confirm new referrers before adding them.
- Check landing pages: Record pages and templates receiving assistant referrals.
- Separate automation: Exclude crawler and agent requests from human totals.
- Export stable fields: Send assistant, source, medium, landing page, engagement, and conversion fields to the reporting layer.
- Document changes: Log channel-rule edits so breaks in the trend have an explanation.
The result is a reliable confirmed-referral layer, not a complete count of AI-influenced traffic.
The Gap Between AI Referral and AI Influenced Traffic
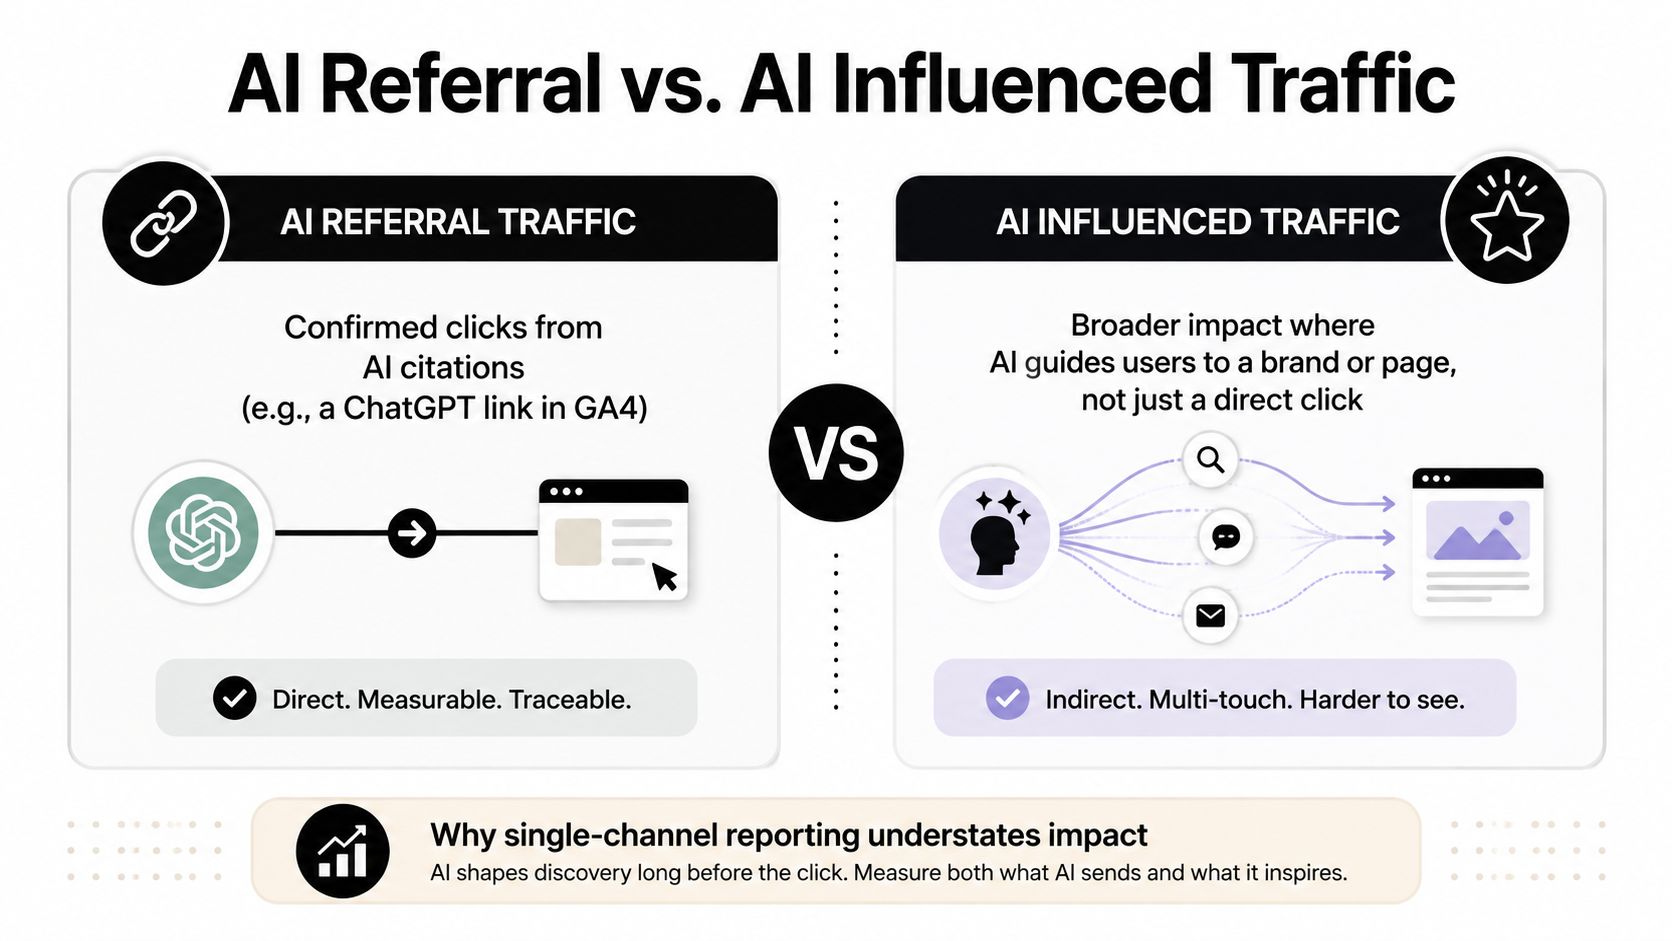
Confirmed AI referral traffic has a defined path. A user clicks a link in an assistant response, the session reaches the website, and analytics records a recognizable source when the referrer survives. That event can be counted and evaluated alongside other acquisition sessions.
AI-influenced traffic has a different path. A user may see a brand in an answer, remember it, search for the brand later, and arrive through Branded Organic Search. Another user may type the domain directly. Standard analytics usually sees the final visit, not the earlier exposure.
Machine Relations' analysis of the AI search measurement gap describes why referral data alone can be misleading. It recommends combining confirmed AI referral sessions with generative impressions, branded search lift, and Direct-traffic anomalies rather than treating referrals as the entire AI traffic total.
Estimate influence without disguising uncertainty
The influenced layer needs a declared method. A team can compare branded search activity during periods with documented AI exposure, inspect assisted-conversion paths, and ask new customers how they discovered the brand. Each method adds a signal, but none should be presented as a confirmed click unless the click was recorded.
A post-exposure survey can ask whether an assistant appeared during the journey. A search analysis can identify a branded query change alongside a documented visibility change. An attribution model can assign directional credit, provided the report labels the result as modeled.
The dashboard should keep the two universes visibly separate:
- Confirmed number: Tracked assistant referrals and their recorded sessions.
- Directional estimate: AI-influenced activity supported by search, conversion-path, or survey evidence.
- Unknown remainder: Exposure that produced neither a detectable referral nor a reliable downstream signal.
Reporting rule: Publish the confirmed figure as fact, the influenced figure as directional, and never combine them into one KPI.
This separation protects the analyst from overclaiming. It also gives executives a clearer decision view. One tile answers how many measurable visits arrived from assistants. Another shows whether broader brand demand moved alongside documented AI exposure.
Tools That Support AI Traffic Analytics
No single tool measures the full AI traffic question. Choose the tool according to the event being measured, then use a separate validation method to test what the result represents.
| Category | What It Measures | Primary Validation Check |
|---|---|---|
| Log-file and server-side referrer parsers | Automated requests, referrers, user agents, and requested pages | Confirm bot identification and separate requests from human sessions |
| GA4 and tag-manager workflows | Browser sessions, source and medium, landing pages, engagement, and conversions | Compare channel rules with raw referrers and tagged-session behavior |
| Brand-monitoring platforms | Mentions, citations, prompt appearances, and visibility patterns in captured answers | Check prompt set, engine coverage, capture timing, and citation definition |
| Attribution suites | Modeled or tested relationships between AI exposure and conversions | Review attribution method, control design, and whether exposure was observed |
| Search and demand datasets | Branded query activity and changes around documented exposure | Confirm query definitions, date alignment, and competing demand changes |
Match the tool to the question
A log parser fits questions about automated requests that never execute JavaScript. GA4 is better for confirmed human sessions and their downstream behavior. A brand-monitoring system can record an answer appearance, but that appearance does not prove a visit.
AI activity may include referrals, crawlers, scrapers, and agents. As noted earlier, AI-driven traffic can be concentrated in particular industries, including retail, e-commerce, streaming, media, travel, and hospitality. That pattern describes the observed distribution in the cited benchmark, not a universal benchmark for every website.
Before accepting a vendor's result, inspect four criteria:
- Methodology: Does the documentation define a referral, citation, impression, crawl, and visit?
- Freshness: Does the dataset show when prompts, pages, and source records were captured?
- Coverage: Does it identify the engines, prompts, domains, and sampling limits?
- Human versus machine logic: Does it separate crawler impressions from human sessions?
The AI Search Signals publication is one option for visibility reporting. Its records focus on how brands are mentioned and which sources appear in AI answers. That dataset can support the visibility layer, while GA4 and server logs remain the stronger sources for confirmed human traffic.
Tool selection is therefore a stack decision. A workable setup may combine server-side evidence, analytics sessions, answer monitoring, and search-demand data. Each source covers a different part of the measurement problem, so the reporting layer should preserve those boundaries rather than force referrals, visibility, and modeled influence into one total.
Building Your AI Traffic Analytics Dashboard
The dashboard should make uncertainty visible. A single AI traffic tile invites the team to mix referrals, crawls, citations, and inferred influence. A layered layout keeps the evidence in the same order in which it becomes less certain.
Use three reporting rows
The top row should contain confirmed human traffic:
- AI referral sessions
- Engaged sessions from assistant sources
- Recorded conversions
- Assisted conversions where the AI referral appears in the path
The middle row should explain where those sessions came from:
- Assistant source
- Session source and medium
- Landing page
- Page template
- Product, category, documentation, or editorial content type
The bottom row should describe visibility and influence:
- Prompt coverage
- Citation coverage
- Share of voice in tested answers
- Branded search movement after documented exposure
- Directional influenced-conversion evidence
The source for the first two rows is typically GA4, supported by server logs. The final row needs answer captures, prompt records, search data, and a documented influence method.
Choose the right reporting view
Standard GA4 reports work for recurring channel and source checks. Explore reports are better for landing-page comparisons, path analysis, assistant-by-assistant breakdowns, and conversion segments. A Looker Studio layer can present the executive view, but it should inherit the same definitions rather than create a new blended metric.
The weekly view is tactical. It checks referrer changes, unusual Direct movement, landing-page shifts, bot contamination, and conversion-path quality. The monthly executive view should pair confirmed AI referrals with visibility records and branded search movement, while labeling modeled influence separately.
Validation rules prevent misleading totals:
- Exclude known automated requests from human session reporting.
- Keep assistant source rules above generic Referral logic.
- Record channel-definition changes beside the reporting period.
- Compare GA4 sessions with server evidence where possible.
- Never count a citation as a visit.
- Never count a crawler request as a human conversion.
- Never combine confirmed and influenced traffic into one total.
A starter checklist can be applied at the next reporting cycle:
- Define confirmed referral, automated activity, and influenced traffic.
- Create the AI assistant channel and document its source rules.
- Build source, landing-page, and conversion views in GA4.
- Validate the classification against server logs.
- Add answer visibility and branded-search evidence as separate layers.
- Publish one confirmed KPI and one clearly labeled directional view.
- Record what the data still cannot show.
That structure gives the CEO a defensible answer. It also gives the SEO team a better question than “How much AI traffic did we get?” The useful question is which AI signals were observed, which outcomes followed, and which parts remain unmeasured.
Teams that want a practical starting point should create the three-layer dashboard, validate its assistant-source rules against server logs, and bring the first confirmed-versus-influenced report to the next weekly acquisition meeting. That review will expose the gaps quickly, while giving stakeholders a cleaner basis for decisions about content, measurement, and AI search visibility.