

Friday morning brings the same problem to a lot of teams. A manager wants a share of voice number for the deck, leadership wants it by channel, and the data lives in three different tools that don't speak the same language. That's where the math gets messy, because the answer depends on whether we're counting mentions, impressions, clicks, or citations.
Share of voice is the percentage of a defined market metric your brand captures against a competitive set. The core formula is simple, SOV = (your brand metric ÷ total market metric) × 100. The hard part is keeping the denominator honest when the channel changes.
What Share of Voice Actually Measures
The fastest way to get stuck is to treat share of voice like one universal number. A marketer can be asked for “SOV” without being told whether the team wants paid media, social, PR, search, or AI answers. That missing detail matters, because the same brand can look strong in one channel and quiet in another.
At the mechanical level, share of voice is a percentage of category exposure or conversation captured by a brand inside a defined competitive set. Brandwatch's glossary describes the standardized form as SOV = (your brand metric / total market metric) × 100, and it uses the same arithmetic across paid media, PR, and social measurement Brandwatch's share of voice glossary. That is why teams can compare visibility over time, but only if they hold the channel definition steady.
One formula, many meanings
The formula does not change. The metric underneath it does.
A paid view might count impressions. A social view might count mentions. A search view might use organic visibility. An AI answer view might count mentions or citations inside responses. The numerator and denominator shift with the channel, and that's the part many reports blur together.
Practical rule: if the numerator and denominator do not use the same metric type, the percentage looks precise but the comparison is weak.
That is why a brand can have a small paid SOV and a much larger social SOV, or the reverse. Those numbers are not contradictory. They're measuring different pools of exposure. The next step is making the arithmetic explicit so the number can survive a budget review, a channel review, or a competitor comparison without breaking.
The Core SOV Formula in Plain Language
A clean SOV calculation starts with one question: what count are you measuring, and who belongs in the category total? Once that is fixed, the math is straightforward, and you can check it by hand when the numbers look off.
Step by step with real arithmetic
Start with your brand's count for the chosen period. Add the same metric for every brand in the competitive set, including your own. That total becomes the denominator.
If Brand A earned 18,400 mentions, and four competitors earned 6,200, 5,500, 4,100, and 3,800, the category total is 38,000. The calculation is 18,400 ÷ 38,000 = 0.4842, and multiplying by 100 gives 48.42% share of voice. The formula is simple, but the result only holds if the time window and competitor list stay fixed.
| Brand | Mentions | Share of Voice |
|---|---|---|
| Brand A | 18,400 | 48.42% |
| Competitor 1 | 6,200 | 16.32% |
| Competitor 2 | 5,500 | 14.47% |
| Competitor 3 | 4,100 | 10.79% |
| Competitor 4 | 3,800 | 10.00% |
The table reads cleanly because every row uses the same metric. Protect that consistency. If one row uses impressions and another uses mentions, the report stops being a comparison and turns into a mix of unrelated counts.
What makes the number trustworthy
The denominator is where most reports go wrong. Change the competitor set mid-quarter, and the historical trend line changes too. Shift the collection window, and the percentage shifts with it. Pull the brand count from one tool and the category total from another tool with different coverage, and the result becomes an approximation, not a clean fact.
A good SOV number is less about the percentage itself and more about whether someone can recreate it from the raw counts.
Brandwatch and other measurement guides describe the same basic ratio, and Brand24's explanation of share of voice measurement uses that same arithmetic structure for practical reporting Brand24's explanation of share of voice measurement.
Choosing the Right Denominator by Channel
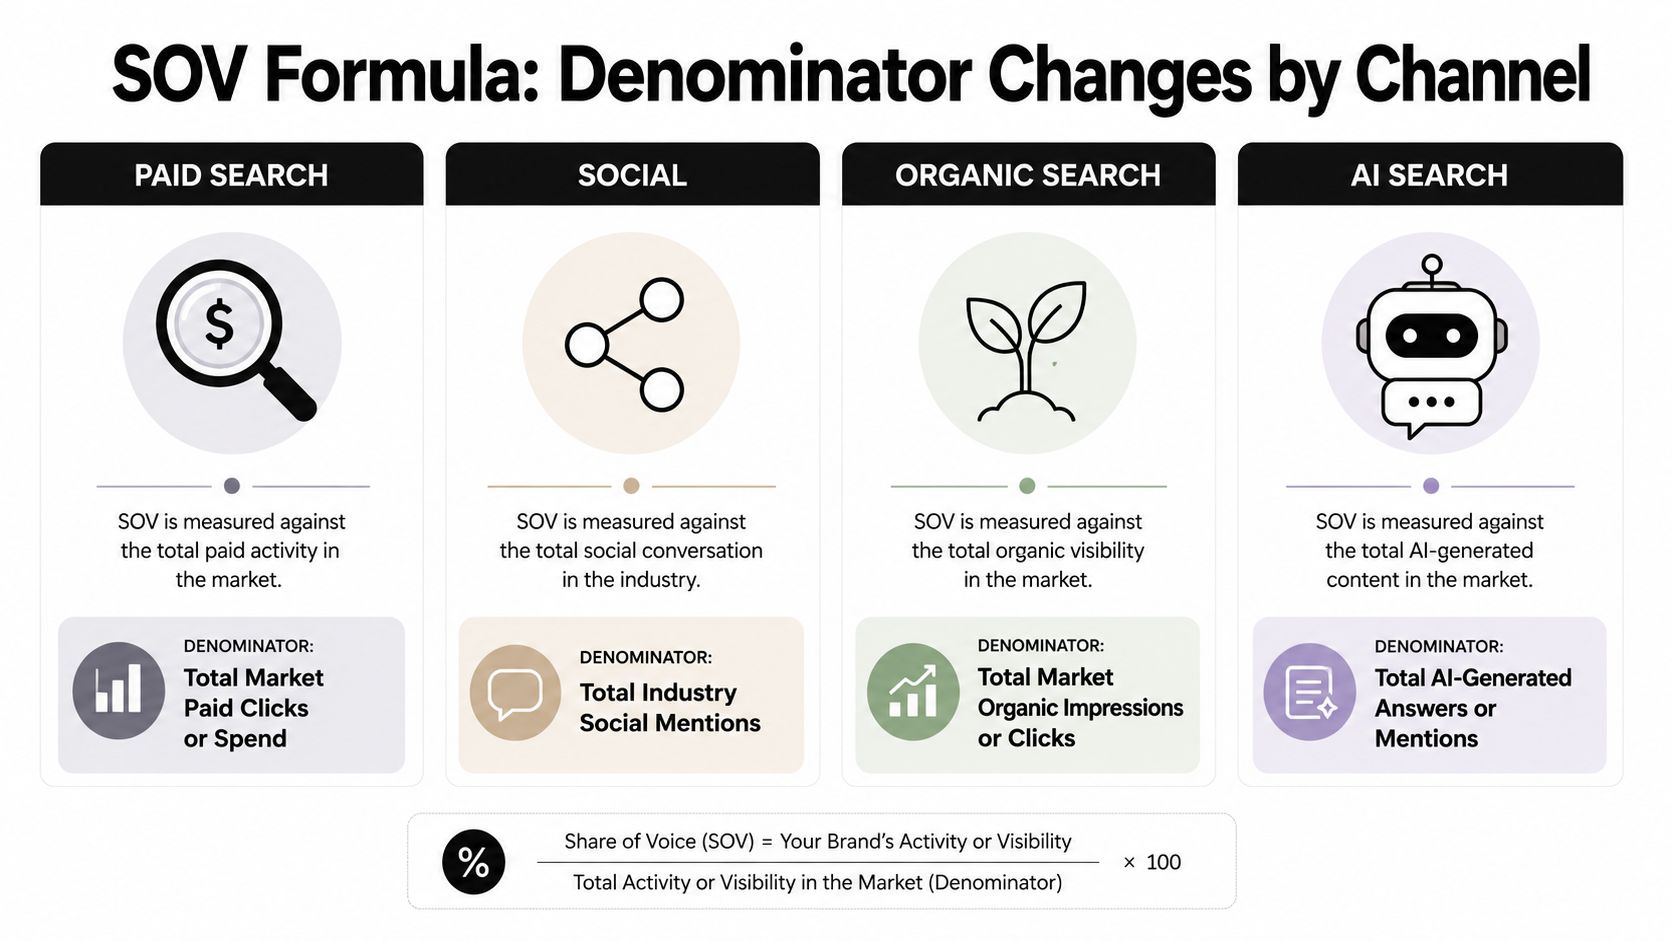
A single SOV formula only works if the denominator fits the channel. Share of voice is still a ratio, but the thing you divide by changes. In one place it may be impressions, in another it may be mentions, citations, or category spend. That is why cross-channel comparisons get messy fast. The same percentage can describe very different kinds of visibility, so the denominator has to stay tied to the channel framing in the channel framing in Agile Brand Guide.
Channel by channel, the math changes
Paid media usually uses eligible impressions or impression share from the ad platform. Your numerator is your brand's impressions, and the denominator is the eligible market inventory for that placement. Organic search usually uses estimated clicks, impressions, or visibility, often from Google Search Console or a search visibility tool. Social and PR use mentions, with the denominator set to total category mentions. AI or answer-engine reporting usually uses citations or brand mentions inside responses, and the denominator is the total relevant citations or mentions in the prompt set you tested. That is the same formula, applied to different pools.
The units do not carry across channels. A mention is not an impression. A click is not a citation. Spend-based SOV helps with budget questions, but it should not sit on the same axis as a mention-based social report, because the math answers a different question.
What to pull from each source
- Paid media: ad platform data for impressions, impression share, or eligible inventory.
- Organic search: search console or visibility tooling for impressions, clicks, or search visibility.
- Social and PR: social listening or media monitoring for mentions and category totals.
- AI search: prompt testing or AI visibility tracking for mentions and citations in responses.
Treat the denominator as the control point. If the source only covers part of the category, call that out instead of presenting the result as a full market share. If the prompt set is narrow, say so. The same applies to AI visibility tracking: if you are counting citations in a defined test set, the percentage is honest only inside that set. Octolens on denominator differences by channel makes the same point from a tooling angle.
A report can show 40% paid SOV and 40% AI citation SOV and still describe two very different outcomes. The percentage is only comparable inside each denominator.
Worked Example for AI Search Visibility
AI search adds another wrinkle because the prompt set becomes part of the denominator. A practical setup is to choose a category-specific universe of prompts, run them against the same brand set, and count what appears in the responses. That keeps the math anchored in the same formula, even though the surface format is different.
A mention-based example
Suppose the team tests 50 category-relevant queries such as “best running shoes for flat feet” across four brands, your brand plus three competitors. Across the prompt set, your brand is mentioned 17 times out of 200 total mentions. The calculation is 17 ÷ 200 = 0.085, which equals 8.5% share of voice.
| Metric | Brand A (you) | Brand B | Brand C | Brand D | Total |
|---|---|---|---|---|---|
| Mentions | 17 | 61 | 54 | 68 | 200 |
The same prompt set can be scored another way. If your brand is cited in 12 of 140 responses containing sources, then citation share is 12 ÷ 140 = 0.0857, or 8.6%. The difference is small, but it matters because mentions and citations are not identical behaviors. One counts being named. The other counts being sourced.
Why the two numbers diverge
The two percentages diverge because the denominator changes from total mentions to total sourced responses. A brand can be named more often than it is cited, or cited in a narrower set of answers that carry sources. That gap is useful. It tells the team whether visibility is coming from being mentioned broadly, being referenced more selectively, or both.
| Metric | Mention Share | Citation Share |
|---|---|---|
| Brand A | 8.5% | 8.6% |
AI response formats are also less stable than classic channel reports. Re-running the same prompt set later can shift what gets mentioned, so single snapshots should be treated as directional. The value is in trend lines built from the same prompt universe, same competitor set, and same scoring rule.
A Simple Reporting Template You Can Copy
A usable SOV tracker is boring in the right way. It should make it obvious what was counted, where it came from, and whether the numerator matches the denominator. Anything else invites quiet mistakes that are hard to spot until a stakeholder asks why two channels were combined.
The fields that keep the math clean
A practical sheet or Notion table can use these columns:
- Date: the reporting period.
- Channel: paid, organic, social, PR, or AI search.
- Metric Type: impressions, mentions, or citations.
- Your Brand Numerator: your count for that channel and period.
- Competitor Set Numerator: the named competitors in the same period.
- Market Total: the denominator for the same metric.
- SOV %: the calculated percentage.
- Source/Tool: where the raw numbers came from.
- Notes: anything that changed, like a campaign launch or a new competitor.
A filled row for paid media might read like this.
| Date | Channel | Metric Type | Your Brand Numerator | Competitor Set Numerator | Market Total | SOV % | Source/Tool | Notes |
|---|---|---|---|---|---|---|---|---|
| Q3 period | Paid Media | Impressions | 1,200,000 | 5,800,000 | 12,000,000 | 10.0% | Google Ads | Q3 campaign flight |
How to keep rows comparable
The rule is simple. The numerator, competitor total, and market total must all use the same metric. If one row uses impressions and another uses mentions, the percentages should never be rolled into a single total. The same is true for AI citations and social mentions. They can live in one view, but not in one calculation.
A useful tracker usually includes separate rows for social mentions and AI citations so the team can see movement without pretending the channels are identical. The AI Search Signals publication provides independent reporting around visibility and share of voice in AI answers, which can fit alongside other tools in that kind of tracker when the team needs a dedicated AI visibility row.
Freeze the competitor list before the reporting cycle starts. Swapping competitors mid-quarter rewrites the history and makes the trend line look cleaner or worse for no real market reason.
Common Calculation Mistakes to Avoid
The most common mistake is adding SOV percentages across channels and treating the sum as one score. That total has no meaning. Each channel uses its own denominator, and one audience can appear in more than one place, so the math can count the same attention twice and blur what moved the needle.
Three ways reports get distorted
Mixing metric types is the easiest way to distort a chart. HubSpot notes that share of voice can be defined around mentions, impressions, media spend, clicks, or traffic, but the numerator and denominator still have to match HubSpot's share of voice overview. If a deck compares share of impressions in paid with share of mentions in social as if they were interchangeable, the ranking looks cleaner than the underlying data allows.
A changing competitor set causes another problem. If a new competitor is added in only one month, the denominator shifts and historical SOV can move without any real performance change. The same issue shows up when a PR push lifts social mentions while paid impression share stays flat. One channel moved, the other did not, and a combined report can hide that split.
Cross-channel SOV is only useful when the denominator is clear. As noted earlier, denominator differences by channel are exactly where the math can break.
The discipline that keeps reporting honest
- One metric type per row: impressions with impressions, mentions with mentions, citations with citations.
- One competitor set per cycle: lock the list before the reporting period starts.
- One interpretation per channel: paid, social, organic, and AI each need their own readout.
That discipline keeps the report useful when teams want to know what changed and why. It also keeps the conversation from collapsing into one oversized number that looks tidy but explains very little.
Putting SOV Into a Reporting Cadence
Share of voice works best when the cadence matches the channel. Weekly pulls make sense for paid and social because those channels move fast and can change during a live campaign. Monthly checks fit organic and AI search better because those views are noisier at smaller sample sizes and often need a little more time to stabilize.
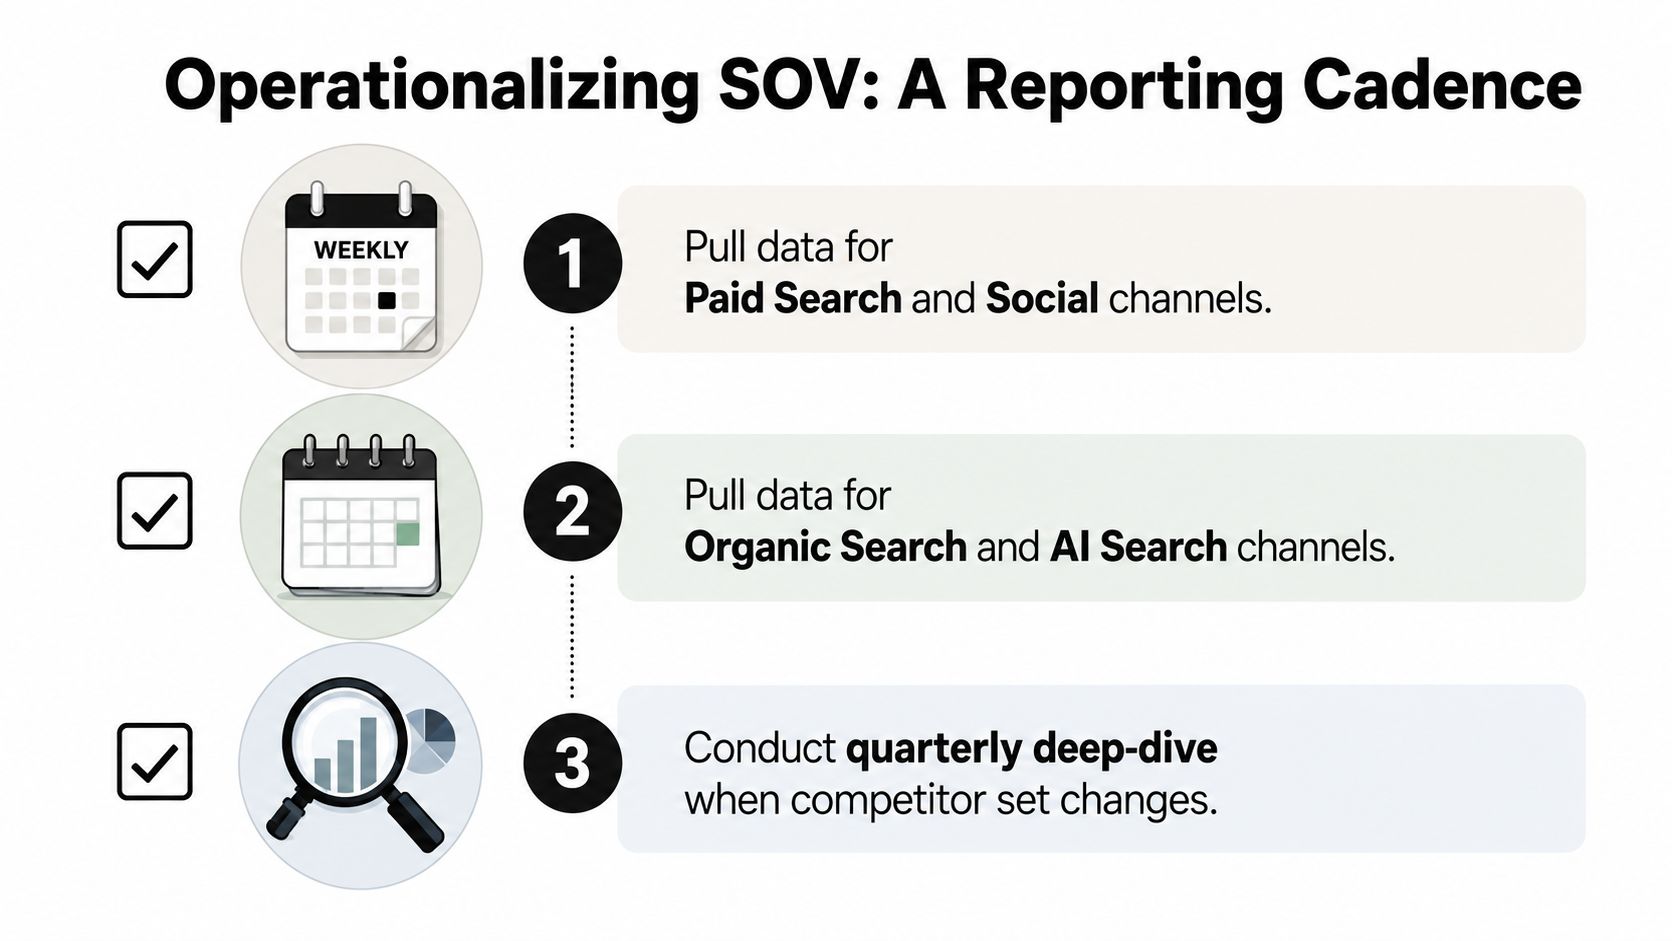
Quarterly deep-dives belong where the competitor set changes or the category changes shape. That is the right moment to revisit the denominator, not every Monday. Daily reporting usually creates noise, while annual reviews arrive too late for the decisions marketers make.
A short publishing checklist
- Metric type confirmed: impressions, mentions, or citations are consistent within the row.
- Competitor list frozen: the same set is used for the whole cycle.
- Window matched: the brand and category total cover the same period.
- Source logged: the team can trace the raw count back to the tool.
- Channel separated: paid, social, organic, and AI are reported on their own terms.
Smaller windows surface movement faster, but they also invite false positives in low-volume channels like AI citations. A rolling trend line or week-over-week movement metric usually gives the clearest read. SOV is a ratio, not a score, so the trend matters more than the snapshot.