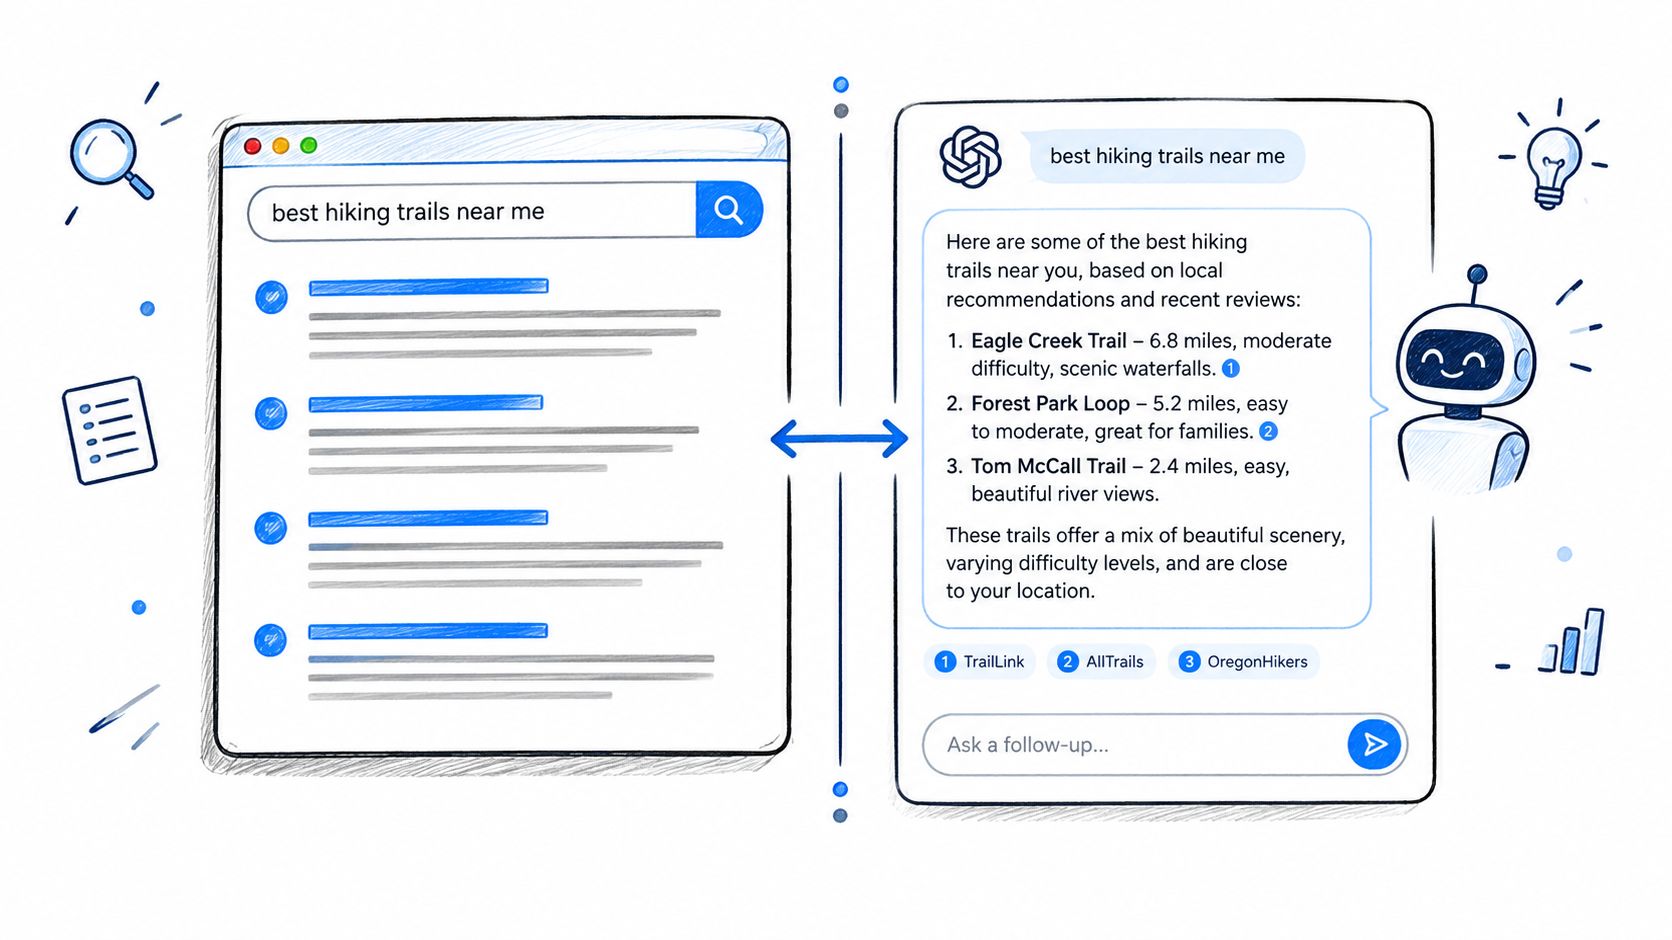

A marketing team can hold strong search positions, earn regular media coverage, and still miss from AI-generated answers. Competitors may show up in category recommendations, source references, and comparison responses, while reporting stays split across rankings and media spend. The result is a fragmented view of visibility.
Share of voice in marketing gives that position a shared language. It began as a measure of category media spending, then expanded to describe mentions, search visibility, social conversation, PR coverage, and appearances in tested AI responses. Search Engine Land's share of voice guide treats it as a broader way to track when a brand appears while someone searches, scrolls, reads news, or asks a chatbot a question.
For SEO professionals, the hard part is not the math. It is choosing the right denominator, capturing observable evidence, and separating visibility from demand. A brand can appear more often without creating stronger consideration.
The practical model is simple. Define the market. Measure the brand's visibility against that market. Compare the result over time, then check demand-side signals to see whether the movement reflects real interest. The sections below build that model from its advertising roots to AI search measurement, then show where interpretation can go wrong.
Understanding Share of Voice From Spend to Visibility
A brand can buy more ads and still stay hard to see. That is why share of voice has moved beyond media spend. Nielsen defines it as a brand's percentage of total category media spending within a defined market, channel, and time period. The denominator is the full media spend for that category in the same market and channel. (Nielsen's definition of share of voice)
That definition answers a narrow question. How much of the category's advertising investment belongs to one brand? It does not measure sales, profit, or customer satisfaction. It measures relative media presence.
The easiest way to separate the old view from the new one is shelf space. If every brand in a category had the same shelf, paid-media SOV would ask how much of that shelf one brand occupies. Modern visibility SOV uses the same logic across search results, social posts, news coverage, and AI answers. The shelf changes, but the comparison stays the same.
The core calculation
For mention-based measurement, the common formula is:
Share of voice = brand mentions ÷ total industry mentions × 100
Cision's share of voice explanation gives a simple example. 100 mentions out of 1,000 total industry mentions equals 10% SOV. The math is straightforward. The harder part is the denominator. “Total industry mentions” should match the same category, period, channel, and monitoring method used for the brand count.
Search, social, PR, and AI each use a different source of evidence. A search version may compare the brand's visibility across a defined query set. A social version may count brand and competitor mentions. A PR version may use relevant coverage. An AI version may count brand appearances within a fixed prompt set, as long as the team records exactly what appeared in each response.
Why the time period matters
One percentage is only a snapshot. A series of consistent measurements shows whether a brand's relative presence is rising or falling.
Brandwatch describes modern SOV as a share of conversation, mentions, or visibility across channels such as search, social, PR, and other environments, while its published Industry Share of Voice Dataset covers January 1 to December 31, 2024. (Brandwatch's share of voice glossary)
That time frame matters because category noise changes. A brand's visibility can grow, while competitors grow faster. In that case, the absolute activity may look stronger, but the share of voice still falls. The metric only helps when the market definition stays stable enough for comparison.
Why Excess Share of Voice Predicts Growth
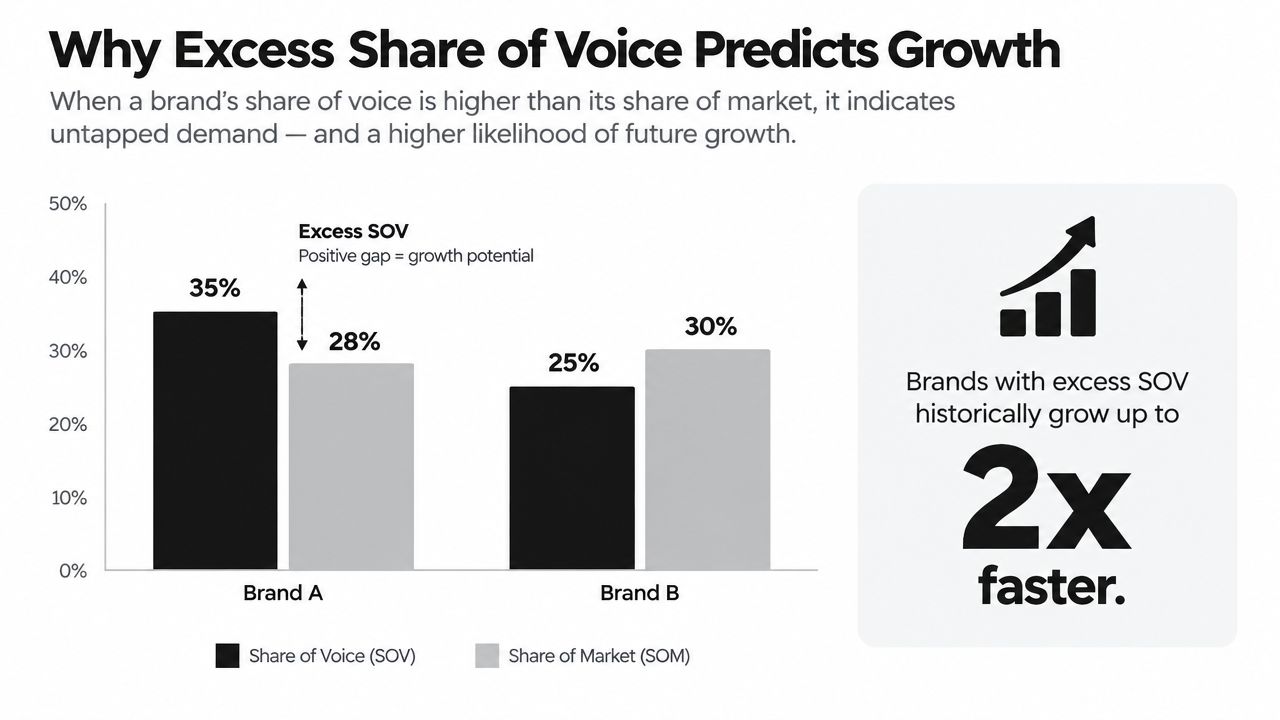
A brand can be visible and still lag in sales. Excess share of voice, or ESOV, measures whether that visibility is higher than the brand's current share of category sales. That gap matters because it compares a visibility signal with an outcome signal.
The main idea is simple. If a brand is showing up more often than its sales share would suggest, it may be building future demand before the revenue shift appears. If its visibility is lower than its sales share, the brand may be relying on past strength while competitors take more of the visible space.
The evidence usually cited for this relationship comes from the WARC summary via Nielsen. It reports that campaigns with share of voice 10 percentage points above share of category sales were linked, on average, with a 0.5 percentage-point increase in market share. The same summary says brand leaders saw a stronger association, with 1.4 percentage points of market-share gain, while challenger brands saw 0.4 points. (WARC's summary via Nielsen)
Those figures show an observed pattern in the cited evidence. They do not prove that extra visibility alone caused the market-share change. Product strength, distribution, pricing, creative quality, category conditions, and execution still shape the result.
Reading the gap correctly
A positive ESOV gap means the brand's visibility is larger than its current sales share. In practice, that can point to future share movement if the measurement covers the right audience and channels. A negative gap means the brand is more dominant in sales than in measured visibility, which can be a warning sign for future consideration.
The leader and challenger split matters. The same visibility gap was not associated with the same market-share movement for both groups in the WARC summary. Teams should avoid turning one relationship into a universal forecast.
Planning rule: Use ESOV as a forecasting signal, not as a promise of growth.
Why SOV can function as a leading indicator
Sales reports show what has already happened. SOV shows how much of the category's visible space a brand is taking up. Used consistently, that makes it a useful question-raising metric for marketers who want to understand where demand may go next.
The method is strongest when the category is defined clearly, channels are kept separate, and the same competitive set is used over time. It gets weaker when paid impressions, organic rankings, social mentions, and AI appearances are merged into one score without explanation. That is more like mixing different measuring cups than reading one clean signal.
How Share of Voice Is Measured Across Channels
A paid campaign, a search result, and an AI answer leave different kinds of evidence. Paid media provides spend or impression data. Social and PR monitoring capture mentions and coverage. Organic search measures visibility across a defined query set. AI measurement records what appeared in tested responses. The structure of SOV stays similar, but the numerator and denominator must match the channel.
Start with the question the measurement needs to answer. For paid investment, use paid-media data. For category conversation, count comparable mentions. For AI discovery, define a prompt set and record responses using a repeatable process. This reframes SOV as a share of visible presence, rather than a single spend ratio.
Choosing the denominator
| Channel | What Counts as Total Market | Typical SOV Input |
|---|---|---|
| Paid media | Category media expenditure or impressions in the selected market, channel, and period | Brand media spend or impressions |
| Social | Industry mentions and conversations captured by the monitoring scope | Brand mentions |
| PR and news | Relevant category coverage captured across the selected outlets | Brand coverage or mentions |
| Organic search | Visibility available across the defined query set | Brand appearances or visibility measure |
| AI answers | Tested responses for the defined prompt set | Brand mentions, citations, or surfaced appearances |
The denominator must use the same unit as the numerator. Brand mentions cannot be compared with total impressions and labelled SOV. A visibility score from one tool also cannot be treated as equivalent to another tool's mention count unless the difference is documented.
Teams can use how to calculate share of voice with real numbers alongside their measurement specification. The software name matters less than the rules behind the calculation: define the market, period, competitors, and event that counts as visibility.
Why channel separation matters
A brand can hold strong paid-media SOV while having weak organic search SOV. It can receive substantial PR coverage and still appear rarely in AI answers. These findings are consistent because each measures a different visibility environment.
A useful dashboard keeps channel-specific SOV visible before showing any combined interpretation. Time-based tracking also makes changes easier to examine than a one-off campaign snapshot. Combining channels may help with planning, but the underlying inputs should remain clear so teams can test the result against demand signals rather than treat SOV as a standalone KPI.
Tracking Brand Share of Voice in AI Answers Without Guessing
A single AI answer can mention your brand, cite your page, or recommend a competitor. That observation is useful, but it is not a market-wide score. AI responses change with the prompt, platform, location, language, date, account, and session conditions. A defensible report describes what appeared under the conditions you tested.
Share of voice can include chatbot interactions as part of a broader visibility measure, as noted earlier. Treat AI answers as a visibility environment, not as evidence of how an internal system works or why it produced a result.
1. Define the prompt set
Begin with questions that represent the category. Include informational queries, solution comparisons, vendor-discovery prompts, and wording customers use. Keep the initial set fixed so later changes have a stable baseline.
Record the platform, date, relevant location, language, exact wording, and account or session conditions. The prompt set is part of the measurement instrument. Changing it casually can change the result without any change in brand visibility.
2. Test responses consistently
Run the same prompts under documented conditions. Manual checks suit a small exploratory sample. A larger program may use a service or API, but evaluate each tool against its published criteria. One vendor's score may count a different event from another vendor's score.
The output should be an observation record. It can state that a brand was mentioned, cited, or surfaced in a tested response. It should not claim that the system favored, ranked, or preferred the brand, because the observation alone does not establish that cause.
3. Record the visibility event
Use separate fields for separate events:
- Mentioned: The brand name appeared in the response.
- Cited: A source associated with the brand was cited or linked.
- Recommended: The response presented the brand as a recommendation.
- Absent: The brand did not appear under the defined rule.
These labels answer different questions. A citation is not a recommendation, and a mention does not establish positive sentiment. Preserve the response text, or an approved record of it, so another reviewer can audit the classification.
4. Calculate the share
If the method counts brand mentions, divide the brand's counted mentions by total industry mentions in the same prompt set, then multiply by 100. Fix the category and competitor list before calculating. Adding a competitor or changing the prompt mix can create movement caused by methodology rather than visibility.
5. Segment before interpreting
Break results down by prompt intent, product area, competitor comparison, and platform when the sample supports it. A blended score can conceal a practical pattern, such as strong visibility for educational questions and weak visibility for vendor-selection questions.
A workflow for brand monitoring for AI results can help teams organize these operational questions. The report still needs the exact test conditions and counting rules.
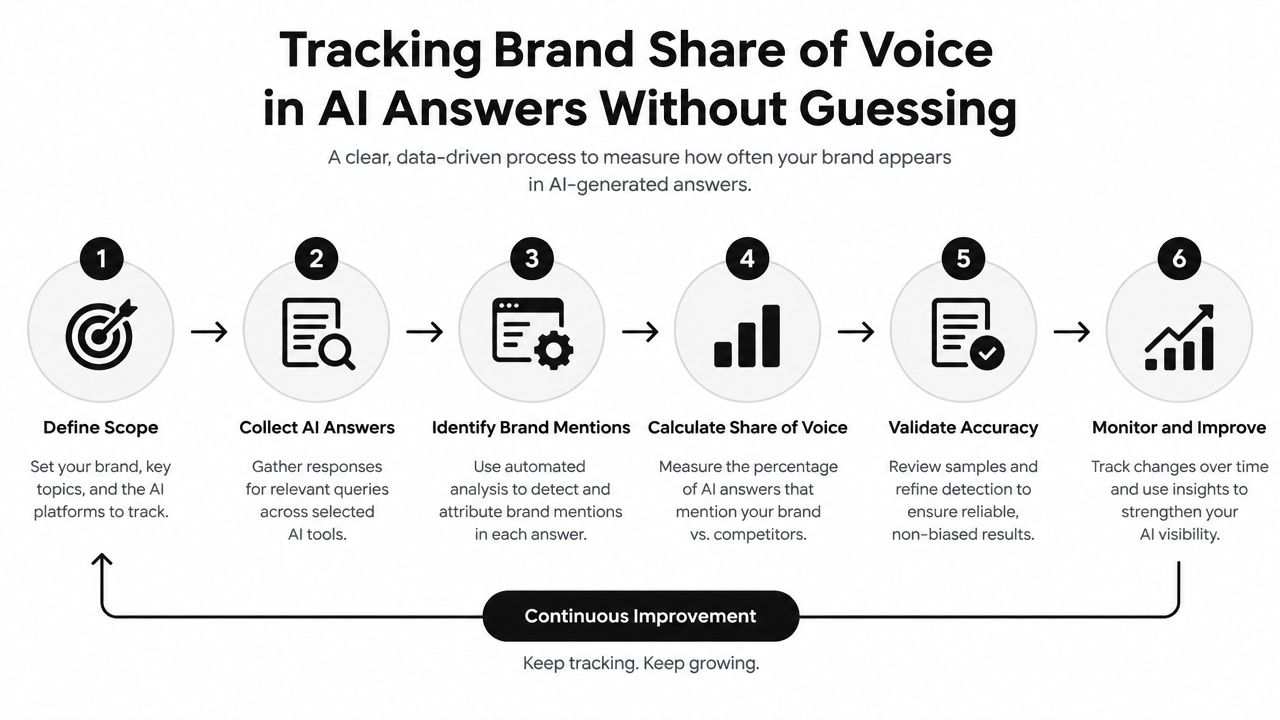
6. Report observations separately from interpretation
A sound report might state that a brand appeared in the tested responses for a defined prompt set, while a competitor appeared more often. The next question is whether that visibility matches branded search, consideration, or another demand signal. Demand data helps validate what the visibility pattern may mean. It does not turn SOV into a standalone KPI.
Reporting standard: State what the response contained first. Explain what the pattern might mean second.
Common Pitfalls When Interpreting Share of Voice
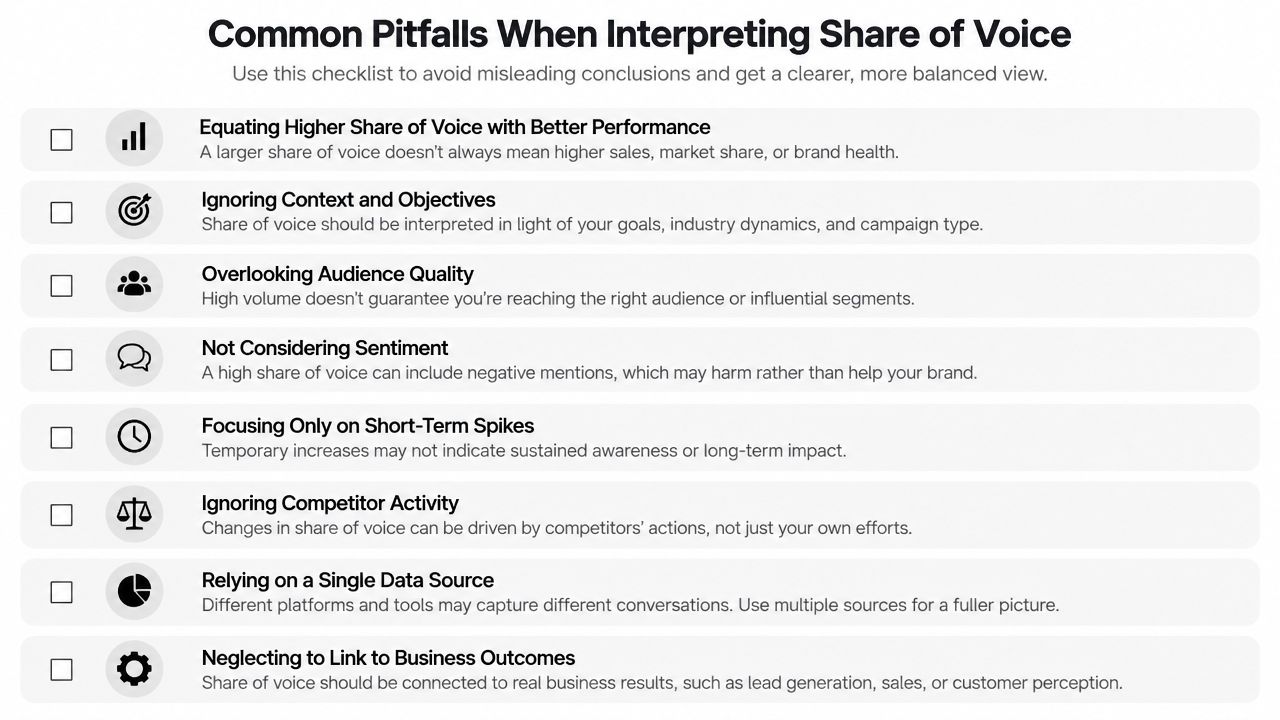
A higher SOV can look positive while hiding a weak commercial signal. A brand may appear frequently in broad discussions yet miss the product questions buyers ask. Treat SOV as a record of visibility across a defined set of channels, not as proof that marketing is working.
The key validation question is: What evidence shows that the visibility matters? More mentions alone cannot answer it. An ESOV approach pairs visibility with brand-aware search and brand tracking, since spend and exposure can move without corresponding demand. See The ESOV measurement discussion for the measurement rationale.
Four checks before drawing a conclusion
- Check the denominator: Confirm that the category, competitor set, channel, and period stayed consistent. A changed denominator can create apparent growth or decline.
- Check the audience: Separate visibility among relevant buyers from broad visibility with little commercial relevance.
- Check the event: Keep mentions, citations, recommendations, impressions, and spend as separate measures. They describe different forms of exposure.
- Check demand: Compare visibility movement with brand-aware search and brand tracking. SOV should support the analysis, not stand alone as the KPI.
Search demand cannot show that a visibility change caused a business result. It is a demand-side signal to review beside the visibility record. The same caution applies to consideration, pipeline, and sales data when those measures are available.
Avoid causal shortcuts
Suppose AI mentions and branded search both rise during the same observation window. Analysts observed two concurrent changes. That pattern can prompt further investigation, but it does not establish that one caused the other without a suitable test.
ESOV also requires careful interpretation. Historical evidence associates a positive gap with market-share growth, but that relationship is not a guarantee across every category, channel mix, or brand stage.
Putting Share of Voice to Work for Your Brand
A practical SOV program can start with one category and one channel. Define the competitive set, choose a counting rule, establish a baseline, and record the denominator beside every result. This makes later changes easier to interpret.
For traditional marketing, the measure might cover paid-media SOV, search visibility, social mentions, or PR coverage. For AI search, use a fixed prompt set. Record whether each brand is mentioned, cited, recommended, or absent in each tested response.
A working decision framework
- Measure visibility: Keep SOV separate for each channel and exposure type.
- Compare position: Review the brand against competitors and, where suitable, share of market.
- Use the gap for planning: Treat ESOV as a planning signal, not proof of an outcome.
- Validate with demand: Compare visibility changes with brand-aware search and brand-tracking signals.
- Audit the method: Check prompts, query sets, platforms, observation windows, and monitoring coverage before changing strategy.
Teams can also use industry benchmarking for marketing teams to compare their method with a defined category instead of relying on one competitor.
A useful report shows the numerator, denominator, observation window, competitor set, and validation signals. It should state what the data cannot prove. Visibility is an input to SEO reporting, brand planning, and AI-search monitoring, not a promise of demand or sales.
Start with one category this week. Record the competitors, counting rule, baseline, and next review conditions. Then compare the visibility result with branded search and brand-tracking signals before recommending a budget or content change.